Influence of secondary ice formation on tropical deep convective clouds
Sun et al. looked at how secondary ice production (SIP) affects strong tropical storm clouds. SIP means that new ice crystals are created from existing ice particles inside a cloud, not just from the first freezing event. The researchers added different SIP processes into a weather model and tested them using a real tropical storm case (a Hector storm).
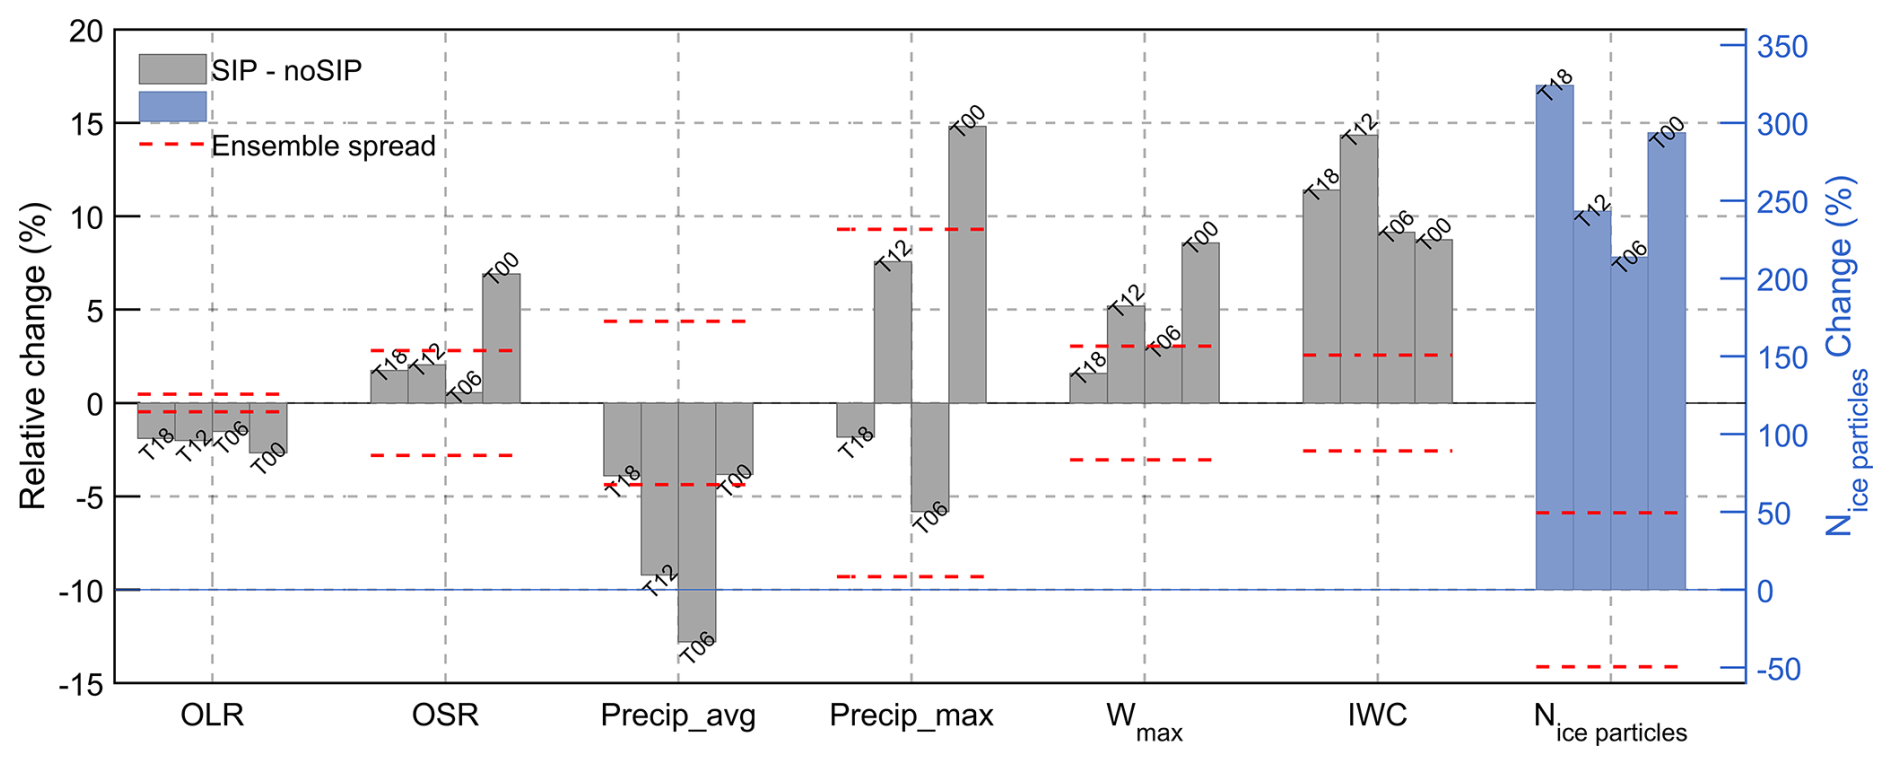
They found that SIP greatly increases the number of ice crystals in the upper part of the cloud, especially in the anvil (the flat, spreading top of a thunderstorm). It also increases the ice water content, which is the total amount of ice in the cloud. Because of this, the cloud reflects more sunlight back to space and traps more heat below. This changes how the cloud affects Earth’s energy balance.
SIP also changes rainfall patterns. Rain becomes more concentrated near the center of the storm, but the total average rainfall over the whole area becomes slightly lower. The strongest rain rates and the storm’s upward winds do not change much.
Among the tested processes, breaking droplets during freezing had the biggest effect on cloud properties. Collisions between ice particles had little impact in this warm tropical environment.
Overall, the study shows that representing secondary ice production in weather and climate models is important for better simulating tropical storms, rainfall, and cloud effects on climate.
https://doi.org/10.5194/acp-25-18549-2025